4. - CHARACTERISTICS OF THE ITALIAN COMMUNITY IN TANZANIA IN THE NINETIES.
Having briefly outlined the historical process which has brought us to the present situation, it is easier to understand the different components that currently constitute the Italian community in Tanzania and the reasons that determined its present composition.
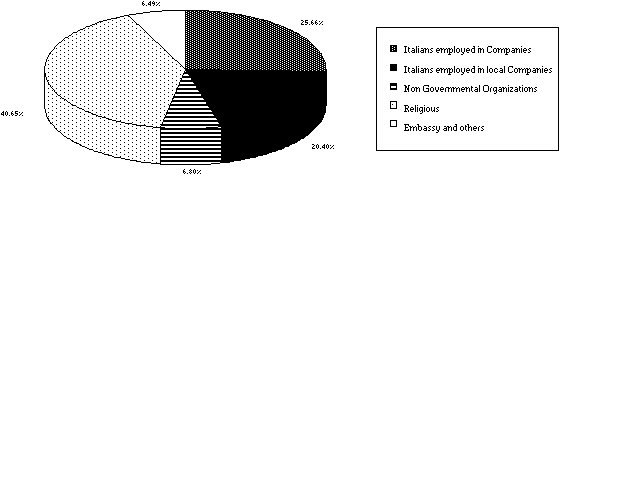
Graph 4.1- Composition of the Italian community in Tanzania (1992)

Source: elaboration of data based on assessments from the consular section
From a first analysis of the composition of the Italian community, conducted through the observation of the data summarized in Chart 4.1, one notes that the principal component is represented by the religious orders which constitute about 40% of the total, followed by nationals employed by Italian firms which represent 25% of the community. The third largest group of Italians is that employed in local enterprises which makes up 20% of the total.
The circumstances which have led to such a composition will be examined in the following chapters, but one can notice at this point that a considerable part of the Italian presence in Tanzania is now connected to our cooperation programmes. In fact the majority of Italians are employed in projects financed by Italian cooperation or by international multilateral agencies (European Union and World Bank.) Additionally a good number of the Italian volunteers and experts present in Tanzania work in programmes totally or partially financed by our cooperation. One can thus affirm that about 30% of the Italians present in Tanzania are tied to our projects of cooperation and are therefore subject to the availability of public funds destined for such purposes.
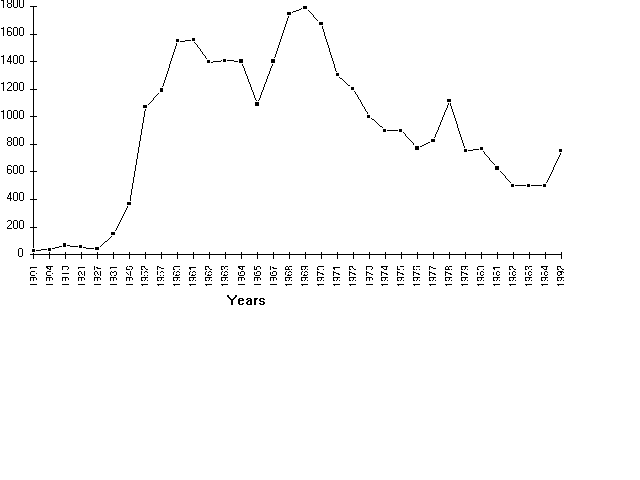
Chart 4.2- consistency of the Italian community in Tanzania (1913-1992*)

* Up to 1964 the data refer only to the territory of Tanganyika. Source: Ministry of Foreign Affairs-"Aspects and problems of Italian emigration to foreign countries-" various years. (1) Ministry of foreign Affairs, Emigration and Colonies, 1906 (2) Ministry of Foreign Affairs, Bulletin of Emigration, 1912 (3)- (4) Tanganyika Territory- Report [on the] Non-Native Census, years 1931, 1948, 1952,1957. (5) Ministry of Foreign Affairs, Census of Italians in foreign countries, 1927 The data for 1960/67 have been obtained from consular records.
The data contained in chart 4.2 refer to the consistency of our community from the beginning of the century to the present day. The data preceding the sixties refer only to Tanganyika; as already described in the previous chapters, these confirm that from the beginning of 1921 and up to the 1970s, the number of Italians present in the country was increasing, and reached its peak from the early 1950s to 1970.
Between 1971 and 1976, however, a marked decrease in the number of Italians was registered. In the years 1977-1978 a sharp increase is noted, probably due to the work on Mtera dam. This is followed by another decrease that reaches an estimated 500-600 nationals. One must bear in mind that the estimates are unfortunately often approximate and the numbers should be considered more in the sense of a trend of emigration in the different periods rather than in a specifically quantitative sense.
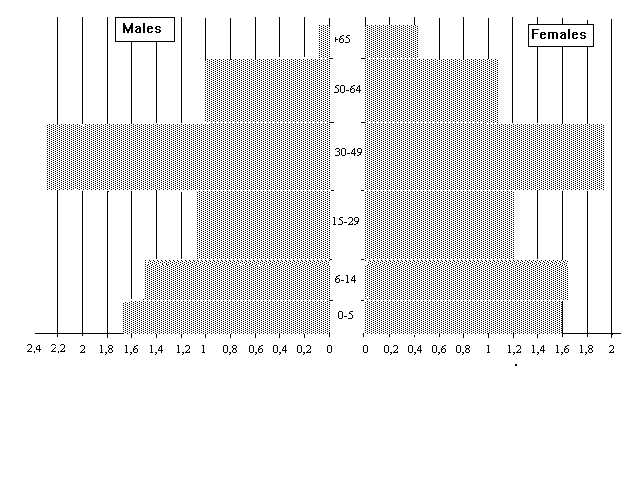
The age and gender structure of the Italian community in Tanzania in the year 1978 is represented in Fig. 4.1. One may note, the age distribution highlights a concentration of nationals aged between 30 and 64 .
Figure 4.1- Age pyramid of Italians in Tanzania (1978)

Source: Processing on Ministry of Foreign Affairs data
In particular the figure highlights a concentration of nationals aged between 30-49 which is often found in communities of workers in foreign countries. The number of nationals aged over 65 is very limited. In fact, the Italian population is mainly composed of people who are not destined to grow old in the host country or country of so-called "technological emigration", as their period of residence is restricted to the need of their skills. Another observation that arises from an analysis of the pyramids is that a large proportion of the Italian community is certainly made up of complete families, as can be deduced from the fact that there is no substantial difference in the distribution of the sexes. One may therefore observe a continued 'refill' assuring a relatively stable structure with ages remaining graphically unchanged in time as is shown in the pyramid.
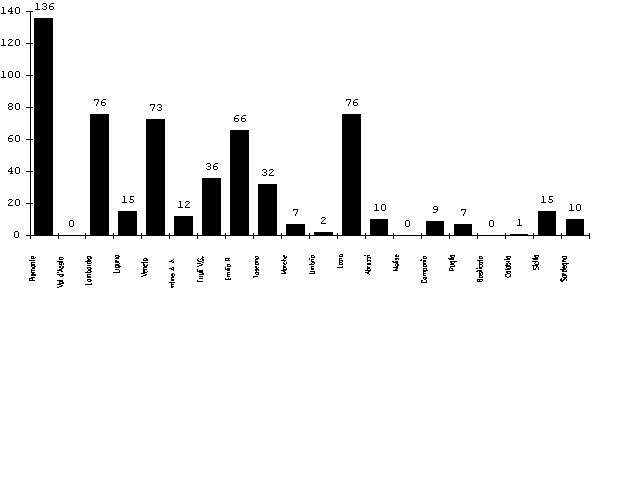
The available data (although probably referred to rough estimates) on the regional origin of the Italians present in Tanzania are represented in Chart 4.1 which refers to 1991. As can be seen, apart from the province fo Piedmont, there are no distinctive concentrations. The observed concentration is probably due to the fact that some important religious orders present in Tanzania have their headquarters in Piedmont.
Chart 4.3- Composition of the Italian community in Tanzania according
to the last region of residence (1991)
