7- CHARACTERISTICS OF OTHER FOREIGN COMMUNITIES
IN TANZANIA.
For historical reasons various foreign communities exist in Tanzania. Variations in the sizes of such communities have in the past been tied to colonial events, while in more recent times they have been considerably influenced by the level of existing cooperation between the different countries (44).
At the beginning of the century the largest foreign community was naturally constituted by the Germans, Tanganyika being one of their colonies. In 1904 the white population was composed of 1,437 persons, among whom were 1,102 Germans, 80 French (almost all religious of the congregation of "White Fathers"), 57 British, 57 Greeks and 30 (45) Italians (Chiesi, 1902, page 779).
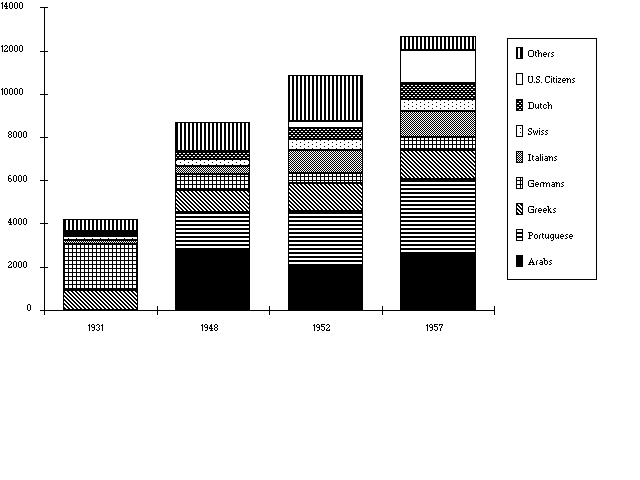
In order to have an idea of how the foreign presence in Tanganyika evolved in the course of this century it is sufficient to examine Graph 7.1. It refers to the data surveyed in the course of the four censuses of the foreign population (i.e. non-native), conducted by the British Administration. Data concerning the British community are not included, while the Arab component, mainly coming from Zanzibar, is substantial (46). Remarkable likewise are the data concerning the Portuguese population composed of those who moved from the neighbouring Portuguese colonies, in particular from Mozambique.
By examining the foreign presence you notice how in the census of 1931 the German community is still very significant, despite the re-entries having followed the end of the First World War. The Greek community is also particularly substantial and increasing in size until the end of the fifties. The Italians were not very numerous in the thirties but they constituted, in 1952, 10% of the foreigners present in Tanzania.
With the independence of Tanganyika and the following constitution of the United Republic of Tanzania many changes in the composition of the foreign population took place. The flows linked to the programmes of cooperation increased, in particular from the Scandinavian countries.
It has to be noted that the data of 1992 contained in Table 7.1 are estimates made by the various diplomatic missions. Even though the data are not precise, they provide an idea of the consistency of the phenomenon and above all they allow a comparative evaluation of the Italian presence in Tanzania.
Graph 7.1- Composition of the foreigners in Tanganyika according to the data of the Censi of the non native population (1931-1957) excluding nationals of the colonial power

Source: Tanganyika territory- Report on the Non-Native Census, years 1931, 1948, 1952,1957
It has to be underlined that our presence, as previously mentioned, dates to the period preceding independence, as does that of the German, British and Greek communities. The latter has suffered a notable reduction compared to their numbers in the fifties when the Greeks constituted one of the largest communities. As regards the other foreign communities present, numbers are linked to the policies of cooperation beginning from the seventies, as in the case of the Scandinavian countries, of China and, more recently, Japan.
Table 7.1 - Estimate of the size of the main foreign communities in Tanzania (OECD countries, Russia and China - 1993)
Country                      Consistency 1979   Consistency 1993Germany                             600               1,500

United Kingdom                      950               1.000

Sweden                              500                800

Denmark                             400                500

Norway                              200                500

Finland                             200                400

Greece                              150                140

Italy                               754                800

United States                      n.a.                800

Japan                              n.a.

China                              n.a.                700

Netherlands                         700                800

Russia                             1,000
Source: Data 1979 from MAE, Aspetti e problemi dell'emigrazione
italiana all'estero (1980).